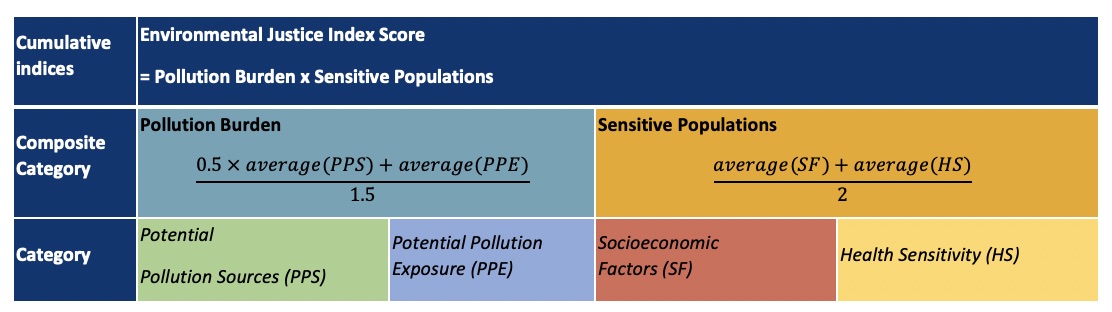
The cumulative impact model calculates cumulative effect scores across environmental hazards and demographic variables for communities across the state, combining measures of potential exposures, adverse effects, sensitivities, and sociodemographic vulnerabilities. This approach is similar to CalEnviroScreen and Washington Environmental Health Disparities Map. The model defines pollution burden as a threat and vulnerability as a sensitive population, highlighting the multiplication of population traits that amplify pollution exposure impacts on vulnerable groups. The model calculates and assigns percentiles based on their impact rank order to understand the total impact for each census tract. The CT EJ Screening Map model uses the Environmental Justice Index to represent the impact score.
Pollution Burden is divided into Potential Pollution Sources and Exposures, while Sensitive Populations are categorized into Socioeconomic Factors and Health Sensitivity. Percentiles and normalized rank scores are obtained from raw values, indicating the percentage of observations in a group. Percentiles are normalized to a rank range of 0-10, allowing for direct comparison and addition of indicators. The final cumulative scores range from 0 to 10, indicating the most impacted communities.
The map displays the cumulative impact of pollution on communities, with indicators assigned numerical values to gauge their impact. Each census tract is assigned a rank from 0 to 10, measuring the relative difference of potential impact factors. Composite indices use averages of rank values to calculate relative rankings. The ranks help identify areas with potential pollution patterns disproportionately affecting the communities. The tool includes color-coded mapping and can create standard reports for selected areas.